Exoplanets
Exoplanets are any planets that orbit a star outside our Solar System. They are a rich area of ongoing research.
Those interested are welcome to view my complete thesis, I Think I See the Light Curve: The Good (and Bad) of Exoplanetary Inverse Problems (2016) — Full PhD Dissertation
Background
Exoplanets are everywhere in the galactic neighborhood — just ask NASA. They can range from gas giants that broil extremely close to their stars to complete systems of rocky, Earth-sized planets. Astronomers find exoplanets several ways using light curves, or the brightness of something over time. Analyzing these light curves is also how we figure out planetary properties like masses, radii, and temperatures. But exoplanets are faint so astronomers need good tools to detect them, such as the James Webb Space Telescope and former Kepler Space Telescope. And we have to understand how our detectors affect the light curves, or else we lose those faint signals in the noise.
For a deeper background (and delightful time capsule) on exoplanets that is still friendly for non-experts, check out the introduction of my thesis. There you can view all the figures in much higher detail — Chapter 1 of PhD Dissertation


Telescope Systematics
Telescopes have detectors to collect light and those detectors influence the observations we take. For example, the Spitzer Space Telescope had a detector of tiny pixels and the sensitivity within each pixel varied. Astronomers kept Spitzer steady to within a fraction of a pixel, but those differences in sensitivity were enough to make exoplanet observations noisy. One way to handle this systematic noise is BiLinearly-Interpolated Subpixel Sensitivity mapping (BLISS-m; Stevenson et al. 2012). This technique calculates a unique noise model to combine with each astrophysical model one tries fitting to their data. We want to know how well BLISS-m works in general, so we test it on many artificial light curves of exoplanet eclipses. BLISS-m has a few issues — picking a good number of meta-parameter "knots" is tricky — but we still find it reasonable for modeling how sensitivity varies within a telescope pixel.
Knot a Bad Idea: Testing BLISS Mapping for Spitzer Space Telescope Photometry (2016) — PASP | arXiv


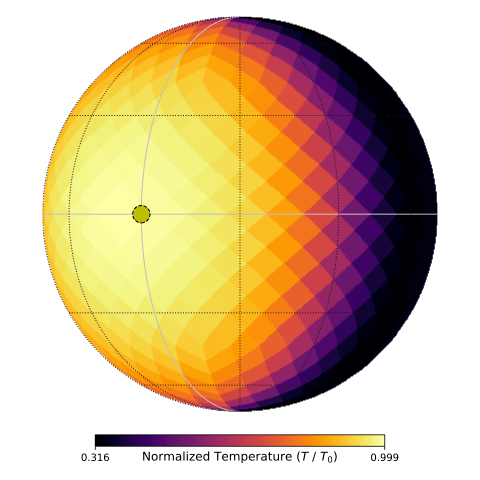
Energy Balance Models
Besides internal heat, a planet gets energy as light from its star. It absorbs some starlight on its dayside and reflects or scatters the rest into space. This affects the planet's temperatures and the amount of energy it re-radiates. On Earth, places rotate into day and night, but some planets are tidally locked to their stars so their daysides never change. For such planets like close-in "hot Jupiters", the nightside only gets energy blown by atmospheric winds. We want to describe the bulk atmospheres of tidally-locked planets, which should be in thermal equilibrium. Using data from infrared and visible light curves, we calculate day and night effective temperatures for hot Jupiters. This lets us infer how reflective each planet is (albedo) and how efficient its winds are (recirculation). Among our findings: hot Jupiters are visibly dark and shinier in the infrared, more stellar radiation tends to make winds less efficient, and one can bias their inferences by assuming the nightside is the coldest hemisphere.
Phase Offsets and the Energy Budgets of Hot Jupiters (2017) — ApJ | arXiv
Balancing the Energy Budget of Short-Period Giant Planets: Evidence for Reflective Clouds and Optical Absorbers (2015) — MNRAS | arXiv
See planetary warmth evolve using the Python platform WheresTheHeat for JupyterLab.


Exo-Cartography
Scientists make accurate maps of Earth by viewing its surface in high resolution. But astronomers cannot send satellites to distant exoplanets nor see those planets in detail with current telescopes. Instead, they can use direct imaging to separate planet light from starlight entering their instruments. Though hard, someday astronomers will directly image rocky exoplanets in visible light, and that will lead to mapping features on rocky worlds. Part of doing this cartography is figuring out where in space a planet's rotational axis points. We want to know how well future direct imaging could constrain a planet's spin axis. So, we analyze how planets are lit up and visible to us — the "kernel" of the problem — for many different system geometries. We find that one could theoretically fit the spin axis by directly imaging a planet at just two to four places in its orbit and sometimes learn the spin direction with more data. That is good news for making maps at interstellar distances.
Inferring Planetary Obliquity Using Rotational and Orbital Photometry (2016) — MNRAS | arXiv
Interact with Exo-Cartography using ReflectDirect, the Python suite for JupyterLab.


Contributing Author
Mapping Exoplanets (2018), contributed figures — Handbook of Exoplanets | arXiv
Analytic Reflected Light Curves for Exoplanets (2018), contributed figures — MNRAS | arXiv
Phase Curves of WASP-33b and HD 149026b and a New Correlation Between Phase Curve Offset and Irradiation Temperature (2018) — AJ | arXiv
Detection of a Westward Hotspot Offset in the Atmosphere of Hot Gas Giant CoRoT-2b (2018) — Nat. Astron. | arXiv
The Very Low Albedo of WASP-12b from Spectral Eclipse Observations with Hubble (2017) — ApJL | arXiv
3.6 and 4.5 μm Spitzer Phase Curves of the Highly Irradiated Hot Jupiters WASP-19b and HAT-P-7b (2016) — ApJ | arXiv
3.6 and 4.5 μm Phase Curves of the Highly-Irradiated Eccentric Hot Jupiter WASP-14b (2015) — ApJ | arXiv
Features in the Broad-Band Eclipse Spectra of Exoplanets: Signal or Noise? (2014) — MNRAS | arXiv


Coding
Computing is critical for modern science: writing algorithms, modeling complex systems, analyzing big data, and displaying findings. I host some of my shared work on GitHub, and you can find useful programs and packages on the Links page.
ReflectDirect
Your Jupyter stage for reflected light from directly imaged planets.
ReflectDirect is a Python suite for anyone wanting to explore exoplanetary systems with JupyterLab. Wrap planets with spherical harmonics, data arrays, or your own images. Align them how you like and choose their orbital and spin rates. See up close how light strikes your planets or observe them from far away. Then go wild: change and compare planets with a couple quick calls or jump into the sandbox for lots of freedom.
ReflectDirect has an online API detailing every function, there's a demo Jupyter notebook to get you started, and the source code is free under the MIT License. Check it out — ReflectDirect on GitHub
Study the science underneath by diving into Exo-Cartography.


WheresTheHeat
A Python microwave for transiting planets on custom orbits.
Built for a JupyterLab near you, WheresTheHeat brings eccentric planets, combo graphics, "smart" modifying, and a rotational wizard to your fingertips. Look for the package, demos and full API — WheresTheHeat on GitHub
Learn about the empirical context by examining Energy Balance Models.
Presentations
As a scientist and educator, you communicate with different people all the time. The more I do it, the more I appreciate good visuals. An interesting picture attracts your mind to the detailed explanation behind it. I strive to be adept in both respects.
Some of the materials below are not too good. Experience makes a big difference. 😉
PhD Defense
The big one at the time. A cold opening that frames the ideas. Many pictures to visualize the concepts. Transitions on everything to step through the story. Even an opportune celebrity guest appearance. This presentation took a lot of work, and I am humbly proud of it.
Use these slides to better understand my research or get ideas for your own talks. The embedded videos make the file large (~75 MB) but it's worth it — PhD Defense Slides


Candidacy
My semi-proposal for a PhD project that never quite happened ... which is more common than I knew then. The overview slide is generic, and yes, I used silly (half-clever) analogies to describe the analysis. The draft was also way too long so I'm glad I had pizza for everyone who suffered it that day. But in the end, the talk was solid. And I like how the chapters flow together with bold images.
Candidacy exams can be stressful. Whether you take one or not, I hope you learn something from mine — Candidacy Exam Slides


Other Slides & Posters
More examples of presentations that have gotten better over time.
Phase Offset Poster: I was an organizer for Exoclimes 2016. Visuals were good and I'd use even larger images and fonts next time.
Obliquity Poster: this one for Pathways 2015 was wordy and needed a better colormap for the main figures, but like the balanced layout.
Obliquity Slides: also gave a talk at Pathways 2015 that was paced well. I've always liked its clean feeling.
Energy Budget Slides: at the AAS 225th Meeting it was a super-brief talk. Go for big pictures, big font and short phrases.
JCS-NBC Energy Budget Slides: Chicagoland exoplanets at the Adler Planetarium for Winter 2014. A part-original talk by piggybacking off Nick's material.
Broadband Eclipse Slides: a 2014 department lunch at Northwestern became a surprise seminar with me the only speaker. Told I handled the existential statistics questions well, which is funny now seeing these.


